Aliyun Prometheus 开启控制面板
Aliyun Prometheus 开启控制面板
如果在 公众号 文章发现状态为 已更新, 建议点击 查看原文 查看最新内容。
状态: 未更新
原文链接: https://typonotes.com/posts/2023/06/06/aliyun-prometheus-dashboard/
怎么说呢? 阿里云的针对其产品集成了 Prometheus 服务采集监控, 带来了很多方便。 但是并没有开放控制面板, 在分析的时候, 还是很不方便的。
本文就使用 Prometheus 的 Remote Read 特性, 在本地打开 控制面板。
1. 获取公网地址
首先进入阿里云的 Prometheus监控服务 -> (选择)实例名称 -> 设置 -> (找到) Remote Read 地址, 并复制 公网地址。
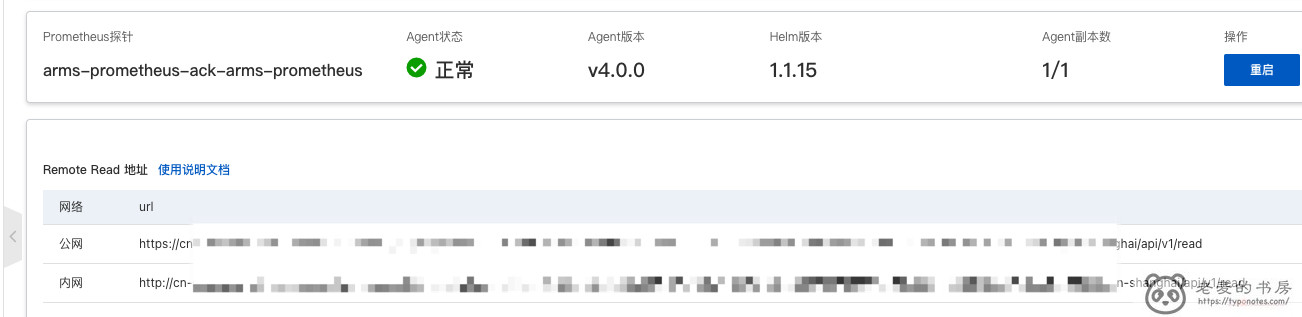
注意: 这里的 公网地址 访问, 其实是 没有鉴权 的。
2. 管理 Prometheus 配置文件
下面为 Prometheus 的远程读配置文件 prometheus.yaml, 其中大部分是直接从 prometheus 镜像中复制出来的。
重点注意 文件末尾的 remote_read 部分。 已做脱敏处理, 具体字段替换成自己的即可。
| |
3. 使用 docker-compose 启动本地镜像
这里直接使用 docker-compose 进行服务管理。 注意之前创建的配置文件的 本地路径 以及 挂载路径。
| |
docker-compose 执行目录结构如下, 都很简单。 这里对应 docker-compose 的配置文件, 因此强调一下。
| |
启动服务
| |
4. 使用浏览器访问
打开浏览器, 访问 Prometheus 的控制面板: http://127.0.0.1:9090
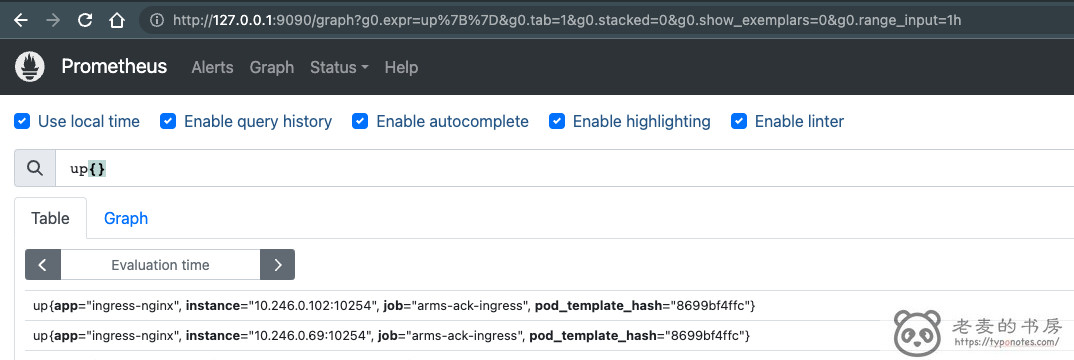
注意: 如果访问结果不一致或者无法访问, 多半是端口冲突了。 试着 修改一下映射端口 或 关闭某些软件。
- 原文链接:https://typonotes.com/posts/2023/06/06/aliyun-prometheus-dashboard/
- 本文为原创文章,转载注明出处。
- 欢迎 扫码关注公众号
Go与云原生或 订阅网站 https://typonotes.com/ 。 - 第一时间看后续精彩文章。觉得好的话,请猛击文章右下角「在看」,感谢支持。