python matplatlib 格式化坐标轴时间 datetime
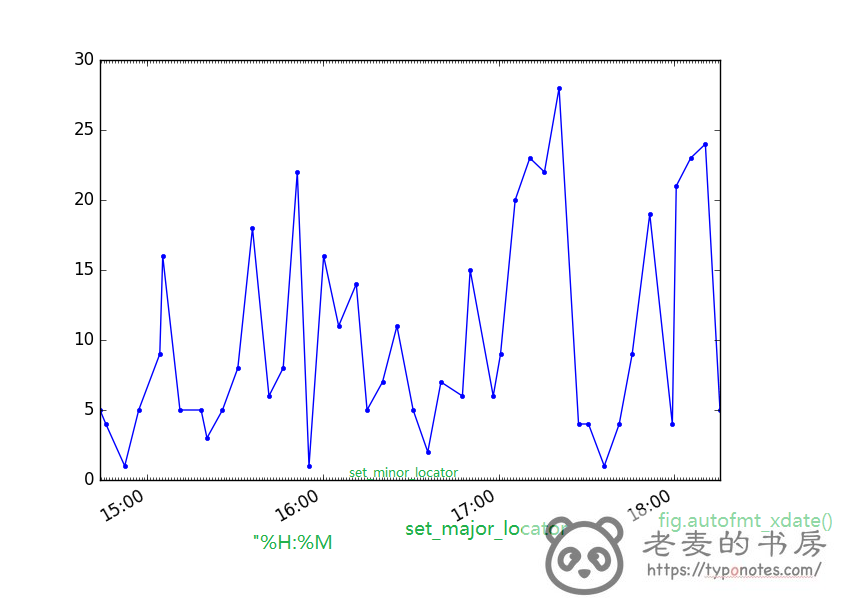
使用 matplatlib.pyploy 可以非常方便的将数组转换成时间。但是,如果是时间 datetime.datetime() 作为坐标轴,如果不对时间进行优化,将会显得非常紧凑。
对坐标轴时间进行优化,用到的库为 matplatlib.dates。主要代码如下
 1
 2
 3
 4
 5
 6
 7
 8
 9
10
11
12
13
14
15
16
17
18
19
20
21
22
23
24
25
26
27
28
29
30
31
32
33
34
35
36
37
38
39
40
41
| import datetime
import matplotlib.pyplot as plt
import matplotlib.dates as mdates
# from matplotlib.dates import YearLocator, MonthLocator, DayLocator
# from matplotlib.dates import drange, DateLocator, DateFormatter
# from matplotlib.dates import HourLocator, MinuteLocator, SecondLocator
def gen_image_2(l):
# 格式化刻度单位
# years=mdates.YearLocator()
# months=mdates.MonthLocator()
# days=mdates.DayLocator()
hours = mdates.HourLocator()
minutes = mdates.MinuteLocator()
seconds = mdates.SecondLocator()
# dateFmt = mdates.DateFormatter('%Y-%m-%d %H:%M')
# dateFmt = mdates.DateFormatter('%Y-%m-%d')
dateFmt = mdates.DateFormatter('%H:%M') # 显示格式化后的结果
if len(l) != 2:
return False
x = l[0]
y = l[1]
fig, ax = plt.subplots() # 获得设置方法
# format the ticks
ax.xaxis.set_major_locator(hours) # 设置主要刻度
ax.xaxis.set_minor_locator(minutes) # 设置次要刻度
ax.xaxis.set_major_formatter(dateFmt) # 刻度标志格式
# 添加图片数据
# plt.plot_date(dates, y, 'm-', marker='.', linewidth=1)
plt.plot_date(x, y, '-', marker='.')
# plt.plot(x, y)
fig.autofmt_xdate() # 自动格式化显示方式
plt.show() # 显示图片
|
以下部分是用来格式化坐标轴上的刻度的。
格式化刻度单位
 1
 2
 3
 4
 5
 6
 7
 8
 9
10
11
12
13
14
15
16
|
# 设置方法
fig, ax = plt.subplots()

# 转化刻度单位
# years=mdates.YearLocator()
# months=mdates.MonthLocator()
# days=mdates.DayLocator()
hours = mdates.HourLocator()
minutes = mdates.MinuteLocator()
seconds = mdates.SecondLocator()

# 应用刻度单位
ax.xaxis.set_major_locator(hours)  # 设置主要刻度
ax.xaxis.set_minor_locator(minutes)  # 设置次要刻度
ax.xaxis.set_major_formatter(dateFmt)  # 刻度标志格式
|
显示格式化后的结果
1
2
3
4
5
6
7
| # 显示
# dateFmt = mdates.DateFormatter('%Y-%m-%d %H:%M')
# dateFmt = mdates.DateFormatter('%Y-%m-%d')
dateFmt = mdates.DateFormatter('%H:%M') # 显示格式化后的结果
# 应用
ax.xaxis.set_major_formatter(dateFmt) # 刻度标志格式
|
填充数据
1
2
3
4
| # 添加图片数据
# plt.plot_date(dates, y, 'm-', marker='.', linewidth=1)
plt.plot_date(x, y, '-', marker='.')
# plt.plot(x, y)
|
坐标轴刻度显示方式
1
| fig.autofmt_xdate() # 自动格式化显示方式
|
显示或保存图片
1
2
| plt.show() # 显示图片
plt.
|
注意: fig.autofmt_xdate() 必须用在填充数据之后
如果不使用 fig.autofmt_xdate() 那么坐标轴显示标志会水平与坐标轴。如果使用了,则会斜靠在坐标轴上,这样就可以显示更多的长标志

github 代码托管
matplatlib API demon
matplot 格式化坐标轴时间表示


